Ala Moana / Kaka’ako
🏝️ Ala Moana / Kaka’ako, Hawaii - Condo Market End of June Update.
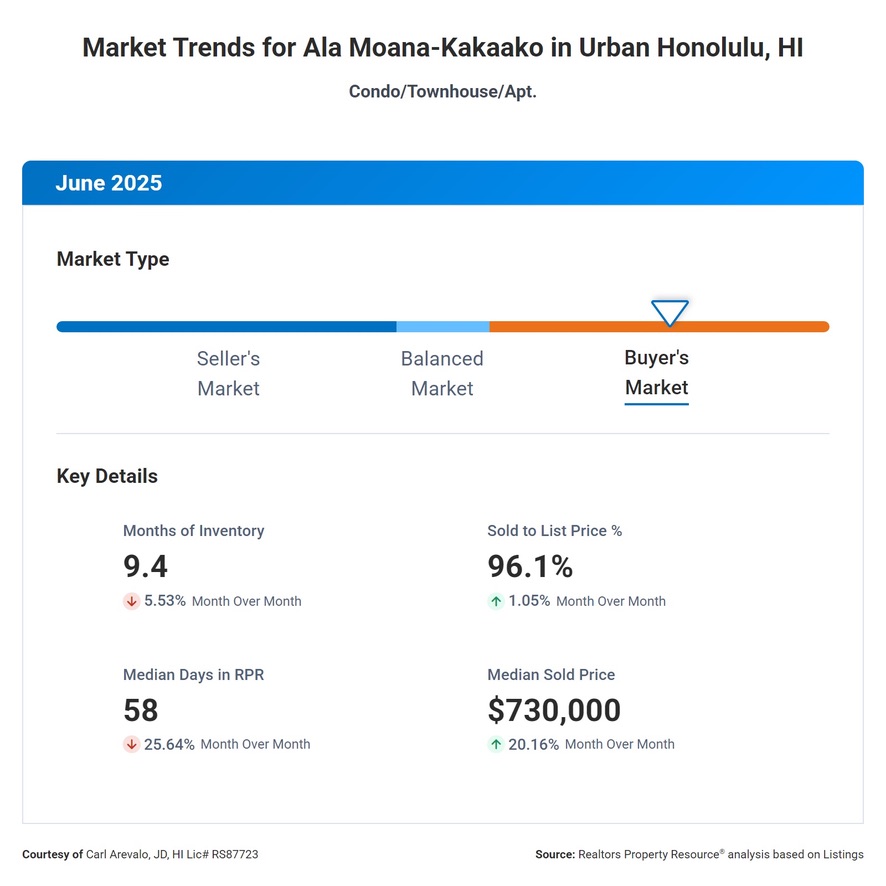
🏡 Analysis:
✅ Currently, the area is experiencing a buyer's market, with 9.4 months of inventory available. This means there are more homes available than there are buyers, giving potential homebuyers more options and possibly more negotiating power. For sellers, it may indicate a need for strategic pricing and marketing efforts to attract buyers.
✅ Homes in this area are currently selling for about 96% of their asking price.
✅ The median days on the market is 58.
✅ The median sold price in Ala Moana-Kakaako stands at $730,000. This benchmark helps both buyers and sellers understand the affordability and pricing standards in the area.
📈 The data is showing a mixed bag and doing a proper Comparative Market Analysis is key - the details of a particular building in the Ala Moana / Kaka’ako neighborhoods are very important and how they affect demand looks very different from block-to-block.
East Honolulu
🏝️ East Honolulu - Single Family Home End of June Market Update
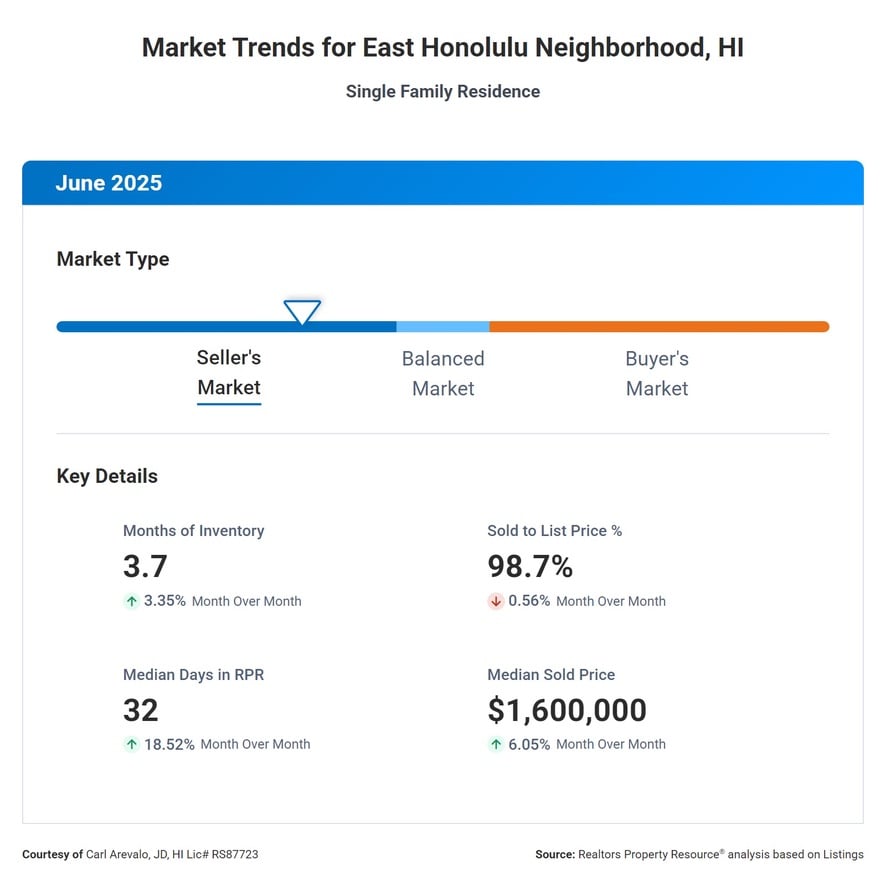
🏡 Analysis:
✅ The East Honolulu housing market is characterized by a months of inventory figure of 3.7, indicating a seller's market.
✅ The inventory trends over the past month and year show slight increases of 3% and 12%, respectively. While these increases suggest a gradual growth in available properties, they are not significant enough to shift the market dynamics away from being seller-friendly. Sellers should remain confident, but mindful that a growing inventory could eventually lead to more competition.
✅ Homes in East Honolulu are selling for about 99% of their asking price. This high sold-to-list price ratio underscores the robust demand and effective pricing strategies. Sellers should aim to price competitively to attract serious buyers while still capitalizing on the market's willingness to meet asking prices.
✅ With a median of 32 days on the market, the pace of sales is relatively steady. This means homes are neither flying off the shelves instantly nor lingering excessively. This suggests that a Seller needs to be tactical and strategic.
✅ The median sold price is currently $1,600,000 and Sellers should consider this figure when determining their listing price, balancing it with their home's unique features and comparables in the area to ensure it aligns with market realities.
📈 In conclusion, the current real estate metrics suggests a market with stable inventory levels, high demand, and properties selling close to their listing price. With that said, despite properties selling close to list price the days on market are a bit extended - so patience is key. Sellers can leverage this information to set competitive prices, attract potential buyers, and ultimately maximize their profits in the current market conditions.
Ewa / East Kapolei
🏝️ Ewa Beach / East Kapolei - End of June Single Family Home Market Update
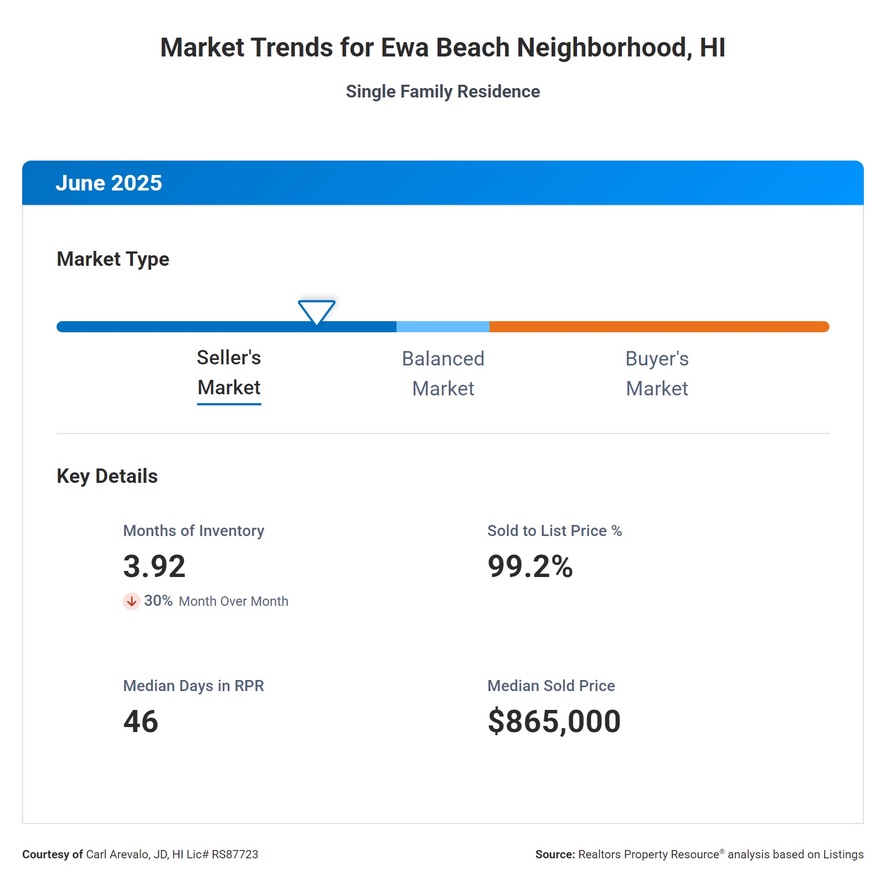
🏡 Analysis:
✅ Ewa Beach is experiencing a seller’s market with 3.92 months of inventory. This indicates a favorable environment for sellers, as there are fewer homes available than buyers, potentially leading to less pressure to lower prices. While the inventory has seen a slight decrease of 30% over the past month, it's up by 45% over the last year. This contrast suggests that while demand is strong, it has begun to stabilize compared to last year.
✅ Homes in Ewa Beach are selling for about 99% of their asking price. This high ratio demonstrates that buyers are willing to pay close to the listed prices, which is a positive sign for sellers looking to maximize their returns.
✅ The median days on market for homes is 46, indicating a steady pace. This means that sellers can expect their homes to be on the market for 1.5 months, if priced and marketed effectively.
✅ The median sold price for homes in the area is currently $865,000. This figure helps set a benchmark for pricing your home competitively while also aligning with buyer expectations in the neighborhood.
📈 In conclusion, the current real estate metrics suggests a stable inventory levels, high demand, and properties selling close to their listing price. With that said, despite properties selling close to list price the days on market are a bit extended - so patience is key. Sellers can leverage this information to set competitive prices, attract potential buyers, and ultimately maximize their profits in the current market conditions.
Kailua
🏝️ Kailua - Single Family Home End of June Market Update
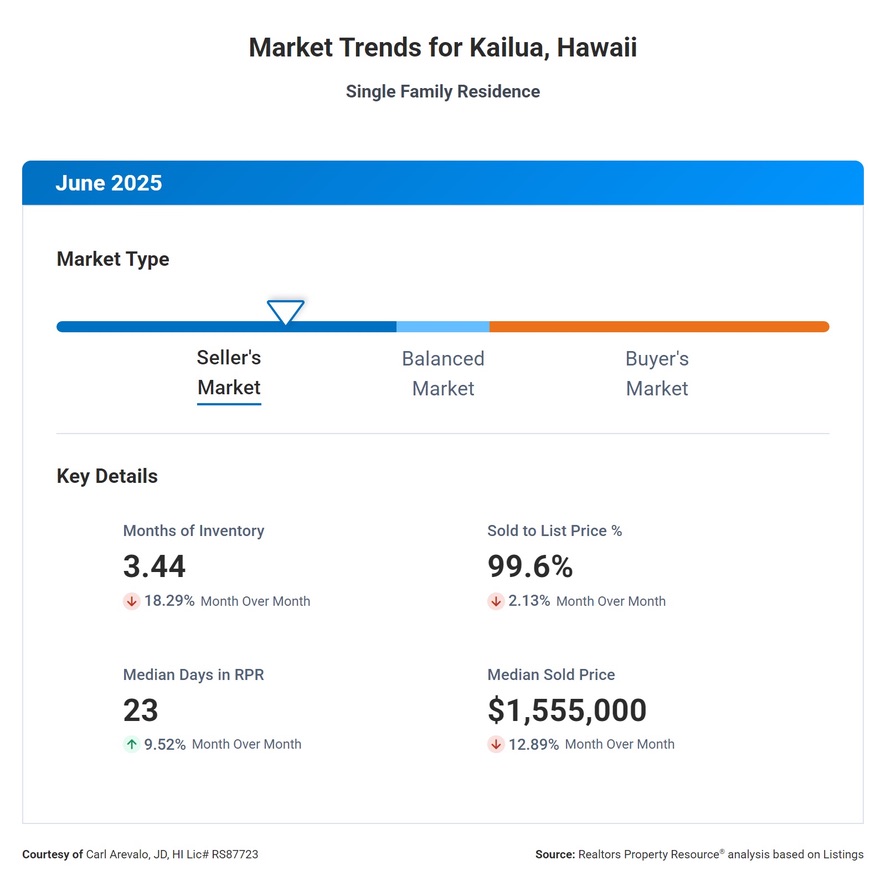
🏡 Analysis:
✅ Kailua is currently experiencing a seller's market, with 3.44 months of inventory. In real estate terms, a market with less than 4 months of inventory typically indicates that sellers have the upper hand.
✅ The Median Days Homes are On the Market, at 21 days, reflects the speed at which homes are selling in the current market conditions.
✅ In the short term, inventory has decreased by 18%, suggesting a slight tightening of the market. However, over the past 12 months, inventory has increased by 13%, indicating a gradual shift toward a more balanced market.
✅ Homes in Kailua are selling for about 100% of their asking price, highlighting the market's competitiveness.
✅ The median days on the market stands at 23, reflecting a steady pace of sales. While homes are not flying off the shelves instantly, they are selling at a consistent rate.
✅ Finally, the median sold price in Kailua is $1,555,000, which sets the benchmark for pricing expectations.
📈 Overall, the correlation between these real estate metrics suggests a seller's market with limited inventory, high demand, strong offers, and favorable selling prices.
Kaneohe
🏝️ Kaneohe - Single Family Home End of June Market Update
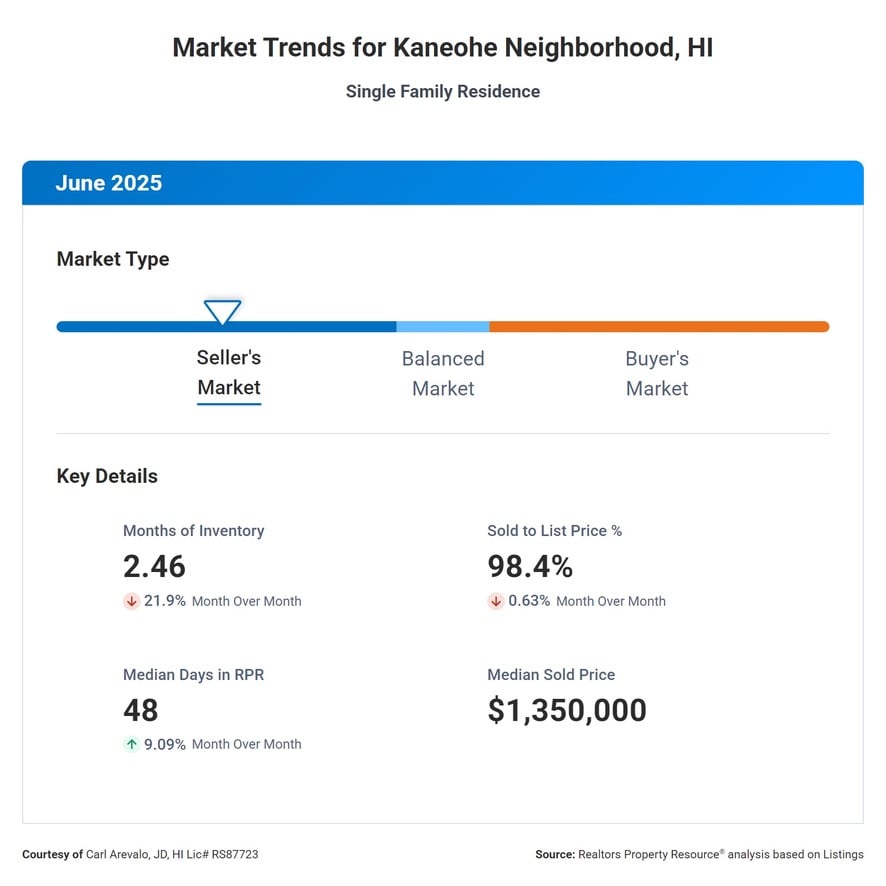
🏡 Analysis:
✅ Currently, Kaneohe is experiencing a seller's market, with a months-of-inventory figure at 2.46 and the median days on market is 48.
✅ The inventory trend over the past month has decreased slightly by 22%, indicating a tightening market, while the 12-month trend shows a marginal increase of 2%. This mixed trend suggests that while short-term conditions are favorable for sellers, but signs the market is trending towards balance.
✅ Homes are selling for about 98% of their asking price. This ratio reflects a robust market where buyers are willing to meet sellers' expectations closely.
✅ The Sold to List Price Percentage is at 99%, suggesting that sellers are getting close to their asking price when selling their homes. This is a strong indicator of a competitive market where buyers are willing to pay closer to the listed price.
✅ With a median sold price of $1,350,000, sellers should set realistic pricing expectations based on current market standards.
📈 In conclusion, the current real estate metrics suggests stable inventory levels, high demand, and properties selling close to their listing price. With that said, despite properties selling close to list price the days on market are a bit extended - so patience is key. Sellers can leverage this information to set competitive prices, attract potential buyers, and ultimately maximize their profits in the current market conditions.
Kapolei / Makakilo
🏝️ Kapolei / Makakilo, Hawaii - Single Family Home End of June Market Update.
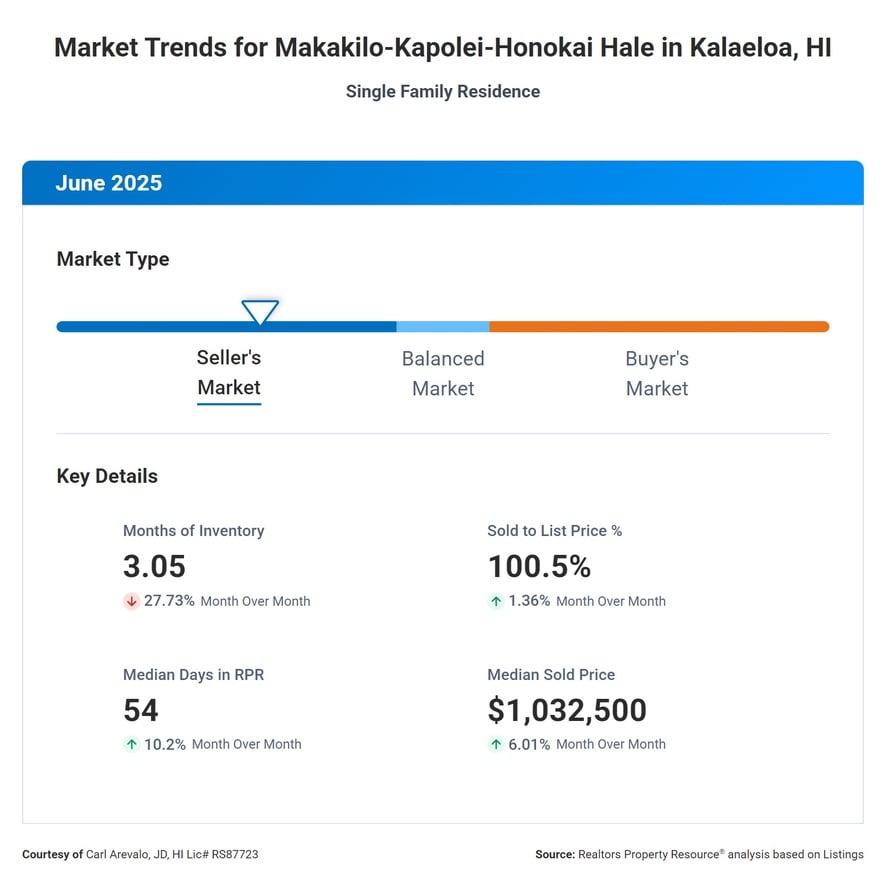
🏡 Analysis:
✅ Currently, the market in Makakilo/Kapolei is classified as a seller’s market, with 3.05 months of inventory. A seller’s market typically indicates high demand and relatively low supply, suggesting a favorable environment for listing your home. With less than four months of inventory, properly marketed and priced homes are likely to attract interest relatively quickly.
✅ Homes are spending an average of 56 days on the market before being sold.
✅ The Sold to List Price Percentage is at an impressive 99%, demonstrating that homes are selling very close to their listing price. This is a good indicator of market stability and confidence in pricing, which can benefit sellers by ensuring that they are receiving fair value for their property.
✅ The Median Sold Price of $973,925 is a strong figure, reflecting the overall health and desirability of the real estate market in this area. Sellers can take advantage of this by pricing their homes competitively and potentially achieving a higher selling price.
📈 In conclusion, the current real estate metrics suggest a balanced market with stable inventory levels, high demand, and properties selling close to their listing price. With that said, despite properties selling close to list price the days on market are a bit extended - so patience is key.
Manoa
🏝️ Manoa - End of June Single Family Home Market Update
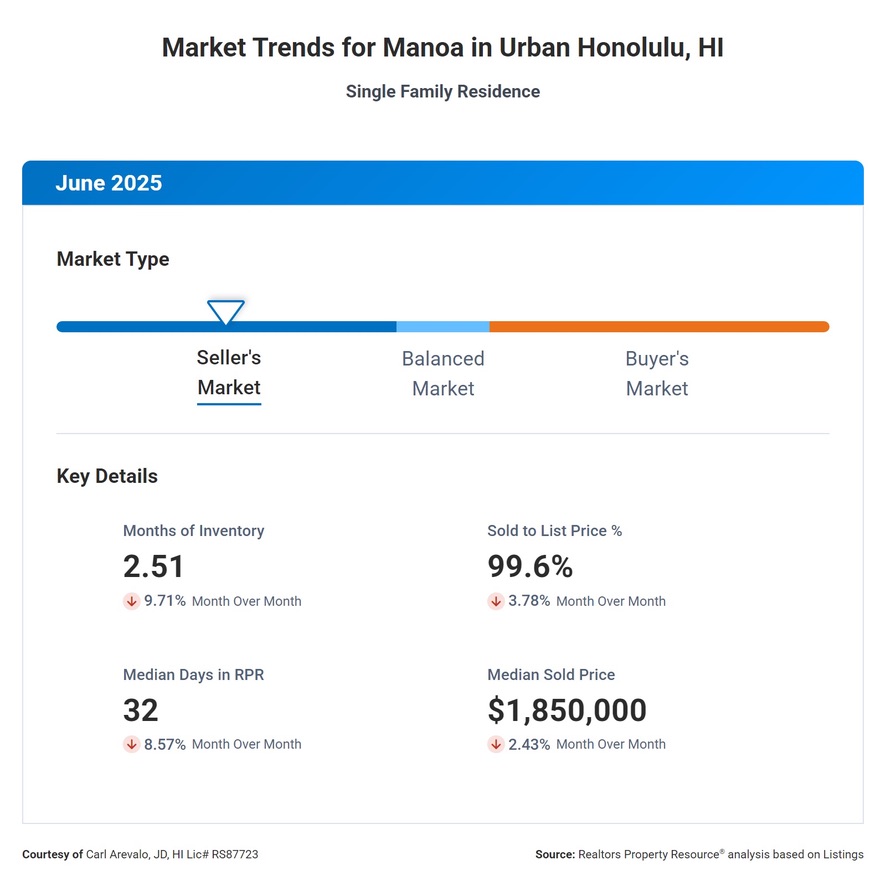
🏡 Analysis:
✅ Manoa is currently experiencing a seller's market with 2.51 months of inventory. This figure indicates that there are relatively few homes available compared to the demand, which typically benefits sellers by potentially driving up prices and reducing the time it takes to sell a home. The inventory has seen a slight decrease of 10% over the past month and a 32% decrease over the past year, emphasizing a tightening market. This contraction suggests that there is a growing demand for homes, making it an opportune moment for sellers to list their properties.
✅ Homes in Manoa are selling for about 100% of their asking price, which means that sellers can expect to receive offers at or near their listed prices. This stability in pricing reflects a healthy market where buyers are willing to meet sellers’ expectations.
✅ The median days on market for homes in Manoa is 32, which indicates a steady pace of sales. This timeframe suggests that, while homes are not selling at breakneck speed, they are moving at a consistent rate that allows for strategic marketing. Sellers should be prepared for a process that allows for adequate time to attract the right buyer while ensuring their home is presented in the best possible light.
✅ The median sold price in Manoa stands at $1,850,000. This figure sets a benchmark for pricing expectations, indicating that Manoa homes are positioned in the higher end of the market. Sellers should leverage this information to price their homes competitively, keeping in mind the quality and unique features that Manoa offers.
📈 In conclusion, the current real estate metrics suggest a market with stable inventory levels, high demand, and properties selling close to their listing price. With that said, despite properties selling close to list price the days on market are a bit extended - so patience is key. Sellers can leverage this information to set competitive prices, attract potential buyers, and ultimately maximize their profits in the current market conditions.
![]() Let’s work together to make your real estate goals a reality! CONTACT US for a personalized consultation
Let’s work together to make your real estate goals a reality! CONTACT US for a personalized consultation ![]()