![]() KAILUA - SINGLE FAMILY HOME MARKET END OF APRIL UPDATE
KAILUA - SINGLE FAMILY HOME MARKET END OF APRIL UPDATE
![]() If you want data on Condos / Townhouses in the Kailua area, please feel free to message me and I will break it down for you.
If you want data on Condos / Townhouses in the Kailua area, please feel free to message me and I will break it down for you.
![]() Additionally, if you would like community news and real estate updates on a more consistent basis please feel free to follow us on our instagram: hookele_homes_hawaii
Additionally, if you would like community news and real estate updates on a more consistent basis please feel free to follow us on our instagram: hookele_homes_hawaii

![]() ANALYSIS
ANALYSIS
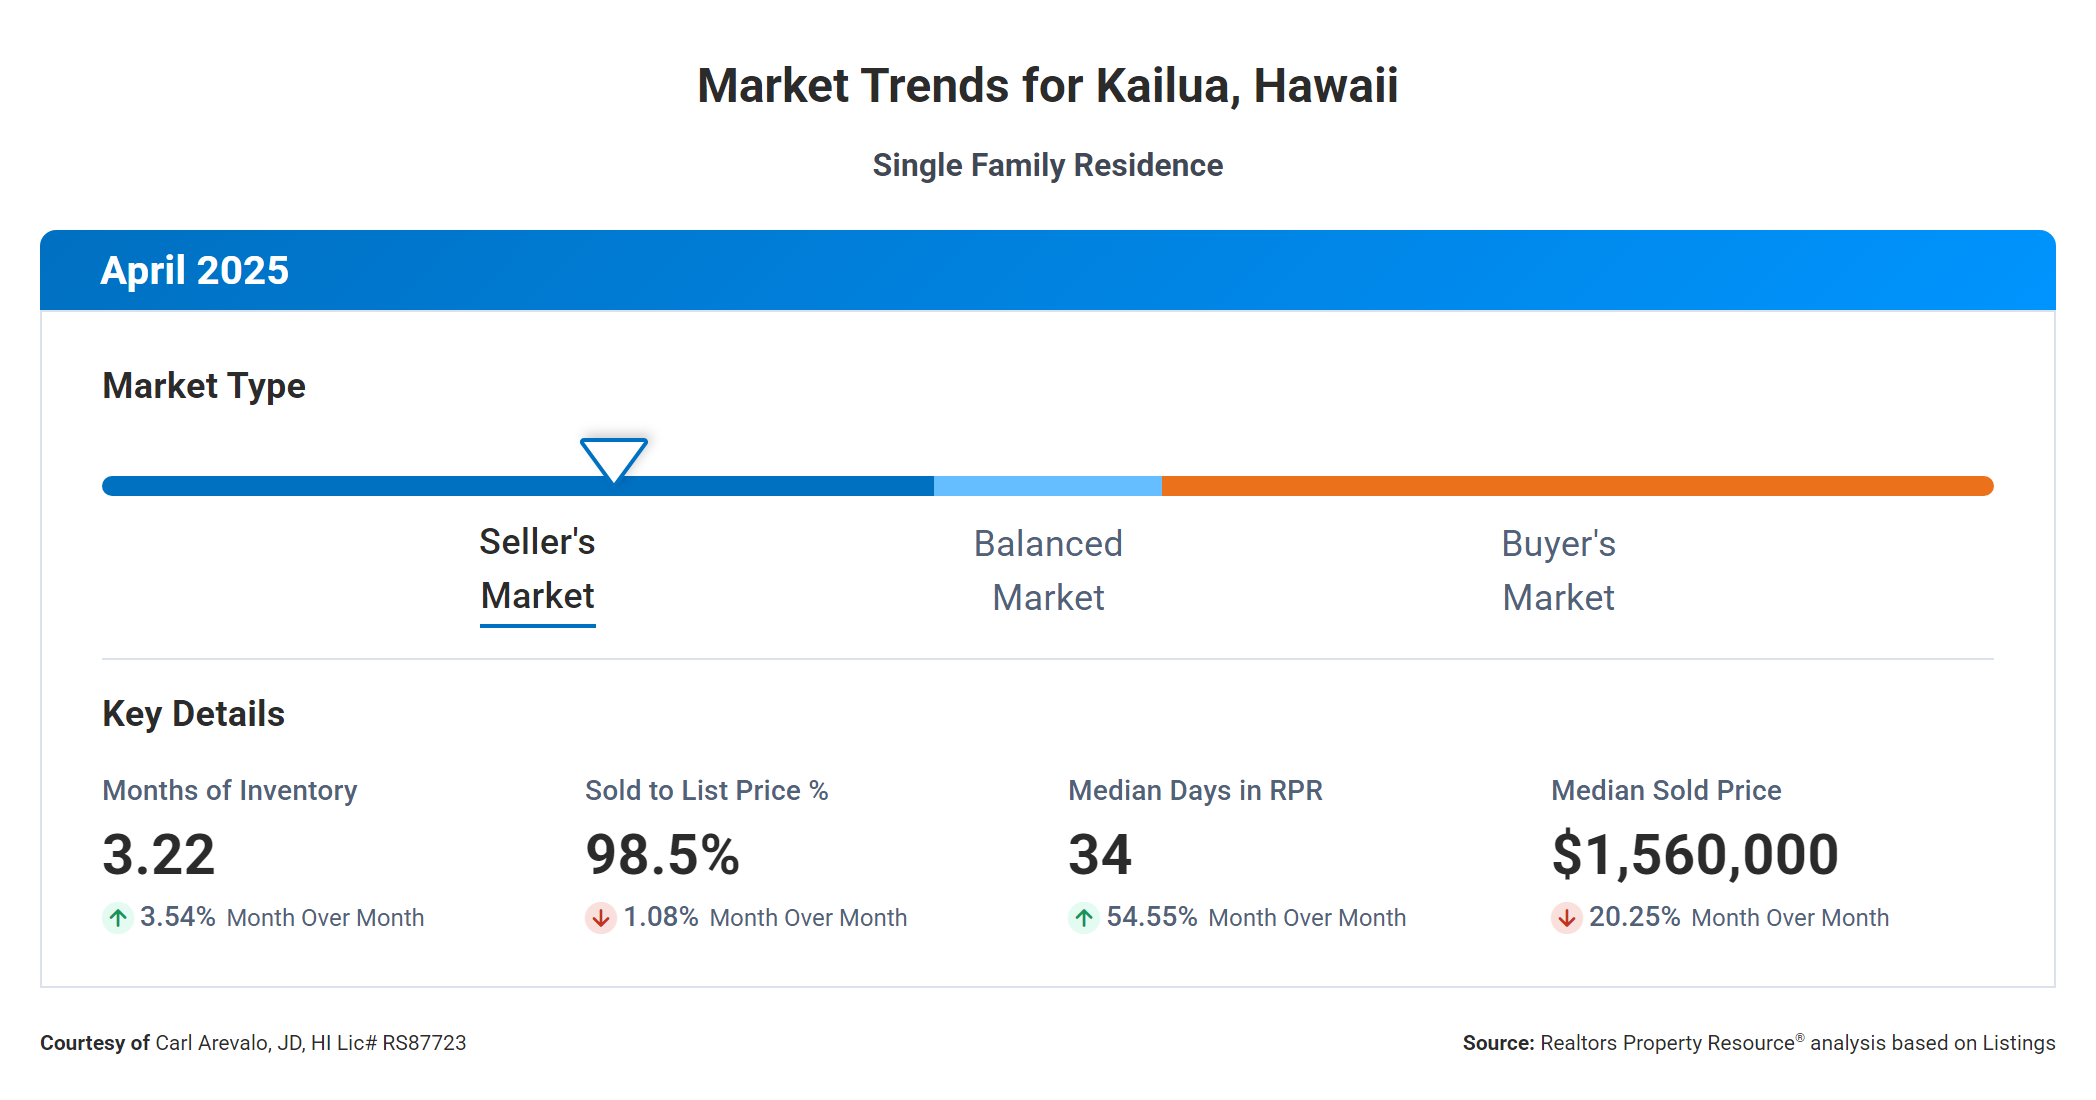
![]() The Months Supply of Inventory is a key indicator of market conditions, representing the balance between supply and demand. A lower number, such as 3.22 months, typically indicates a seller's market, where there are more buyers than available properties. This can lead to increased competition among buyers and potentially higher prices for sellers.
The Months Supply of Inventory is a key indicator of market conditions, representing the balance between supply and demand. A lower number, such as 3.22 months, typically indicates a seller's market, where there are more buyers than available properties. This can lead to increased competition among buyers and potentially higher prices for sellers.
![]() The Median Days Homes are On the Market is a measure of how long it takes for a property to sell. A shorter time frame, such as 34 days, suggests a strong demand for homes in the area and may indicate a seller's market.
The Median Days Homes are On the Market is a measure of how long it takes for a property to sell. A shorter time frame, such as 34 days, suggests a strong demand for homes in the area and may indicate a seller's market.
![]() The Sold to List Price Percentage is another important metric for sellers, as it reveals how close to the asking price homes are selling for. A high percentage, like 98.5%, indicates that sellers are receiving offers close to their listing price, which is a positive sign for those looking to sell.
The Sold to List Price Percentage is another important metric for sellers, as it reveals how close to the asking price homes are selling for. A high percentage, like 98.5%, indicates that sellers are receiving offers close to their listing price, which is a positive sign for those looking to sell.
![]() Lastly, the Median Sold Price of $1,560,000 gives sellers an idea of the average selling price in the area. This information can help sellers determine a competitive listing price for their own property and set realistic expectations for the sale.
Lastly, the Median Sold Price of $1,560,000 gives sellers an idea of the average selling price in the area. This information can help sellers determine a competitive listing price for their own property and set realistic expectations for the sale.
![]() Overall, these metrics collectively suggest a strong seller's market with high demand, quick sales, and competitive pricing. Sellers may have the opportunity to capitalize on these market conditions and achieve favorable outcomes when listing their properties.
Overall, these metrics collectively suggest a strong seller's market with high demand, quick sales, and competitive pricing. Sellers may have the opportunity to capitalize on these market conditions and achieve favorable outcomes when listing their properties.
![]() Let’s work together to make your real estate goals a reality! CONTACT US for a personalized consultation.
Let’s work together to make your real estate goals a reality! CONTACT US for a personalized consultation. ![]()
Check out this article next